
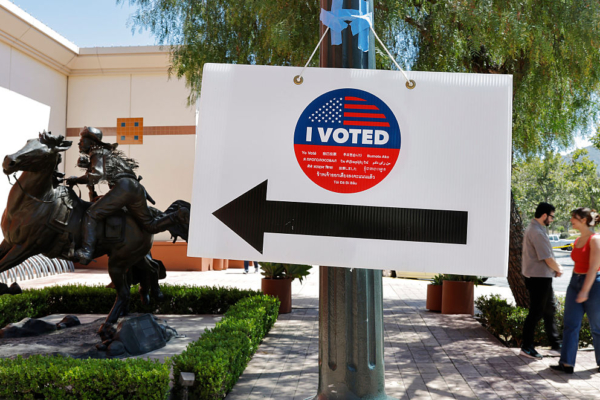
As the November elections are just two months away, the Public Policy Institute of California (PPIC) recently released a briefing on the voter registration status in California. As of May 2026, out of 27.3 million eligible adults, 23.2 million have registered as voters, accounting for 85%.
California has the highest number of Democratic Party registered voters, but in recent years, there has been a slight decrease in the proportion of Democratic Party voters, while the Republican Party voter proportion has slightly increased. Among non-partisan voters, the majority lean towards the Democratic Party. Understanding the party affiliation and voting tendencies of voters in a specific district makes it easier to predict election outcomes.
“Likely voters” are those who are registered, regularly vote, and actively participate in politics. According to a 2025 survey, 46% of likely voters are Democrats, 27% are Republicans, 25% are non-partisan, and 2% are registered members of other parties.
Ideologically, 39% of likely voters hold liberal views, 32% hold moderate views, and 28% hold conservative views.
According to PPIC, Latinos account for 39% of California’s population, white people make up 35%; however, among frequent voting voters, white people make up 47%, Latinos make up 38%, Asians make up 15%, and African Americans make up 6%.
Among frequent voting voters, people aged 55 and above constitute 49%, those aged 35-54 constitute 30%, while young people account for only 21%, despite making up 30% of the total adult population.
Over 60% of Californians have received a university education (including 36% being university graduates and 28% having some college experience). Among frequent voting voters, this percentage exceeds 80% (49% are university graduates, and 34% have some college experience).
Among frequent voting voters, 70% have an annual household income of over $100,000, 23% earn between $40,000 and $90,000, and 7% earn less than $40,000.
“Infrequent voters” are those who are registered but participate less in activities. In this group, 42% are Democrats, 22% are Republicans, 34% are non-partisan, and 3% are registered members of other parties.
In terms of ideology, among infrequent voters, 24% hold liberal views, 51% hold moderate views, and 25% hold conservative views.
Ethnically, among infrequent voters, Latinos make up 42%, whites make up 25%, Asians make up 19%, and African Americans make up 9%.
PPIC’s statistics on unregistered or unable-to-register adults include both US citizens and non-US citizens. Among them, 37% lean towards the Democratic Party, 14% towards the Republican Party, and approximately 50% do not lean towards any party or have uncertain attitudes.
Among unregistered voters (including non-citizens), Latinos account for 59%, Asian Americans 17%, whites 16%, and African Americans 6%.
California voters mostly cast their votes based on party affiliations, and non-partisan voters also play a significant role in influencing election outcomes. Among non-partisan voters who vote regularly, 43% lean towards the Democratic Party, 25% towards the Republican Party, and 32% do not lean towards any major party or have uncertain attitudes.
In non-partisan voters who do not vote regularly, 30% lean towards the Democratic Party, 23% towards the Republican Party, and 47% do not lean towards any party or have uncertain attitudes.